Skewt
A real skew-T, drawn for a phone screen instead of shrunk onto one.
Get it on Google Play- Status
- Available
- Platforms
- Android
- Data
- Open-Meteo forecast · IEM observed (North America)
- Indices
- CAPE · CIN · LCL · LFC
- Plan
- Annual subscription · 14-day free trial
What it does
03-
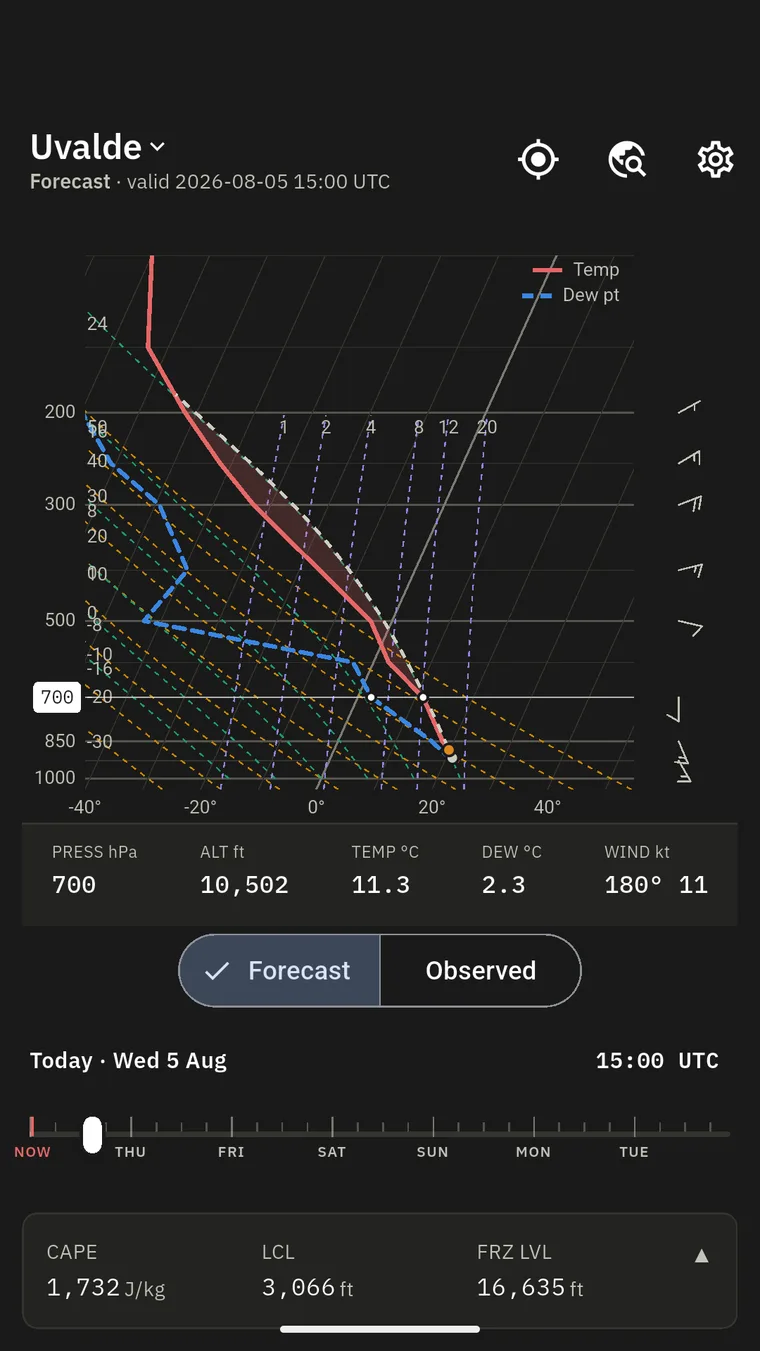
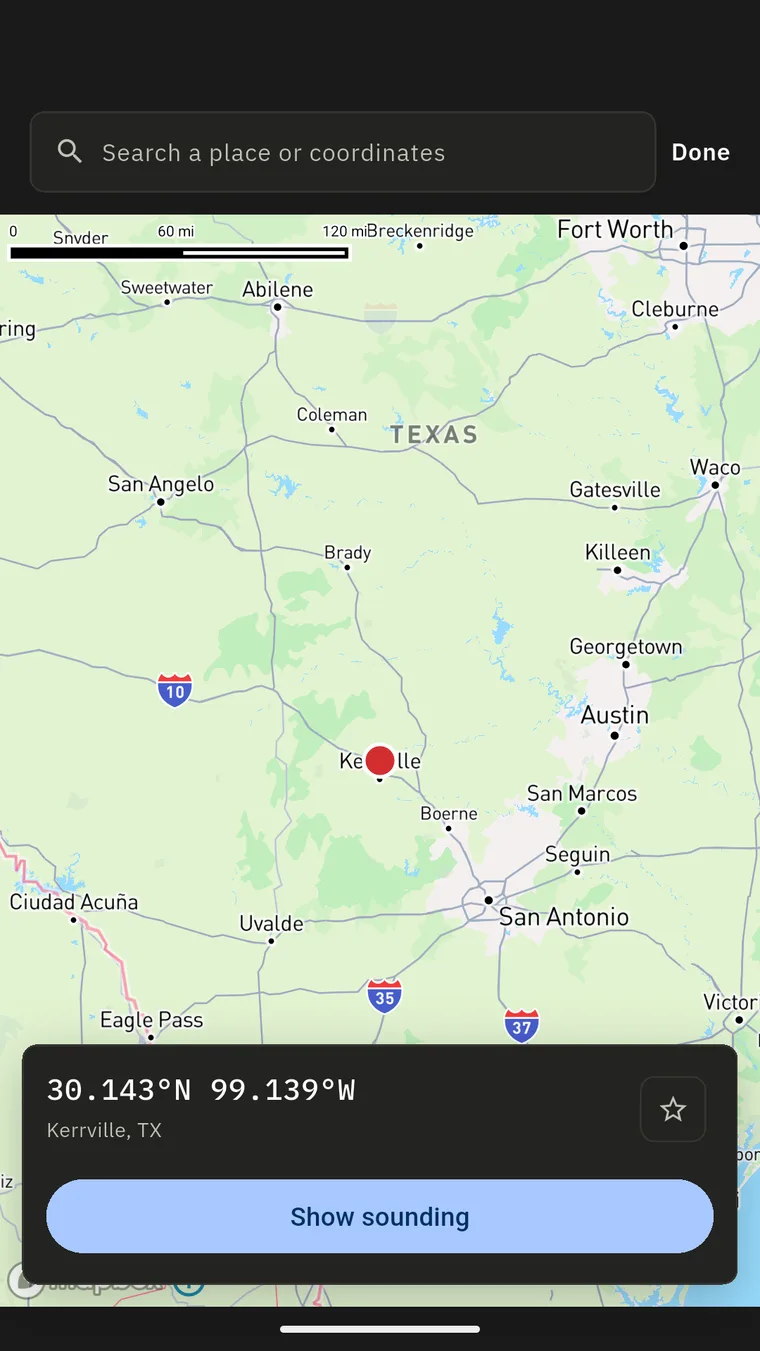
Read a real skew-T for any location — tap the map, search a place, or use where you are.
-
Scrub through the forecast hours and watch the profile change instead of reading one snapshot.
-
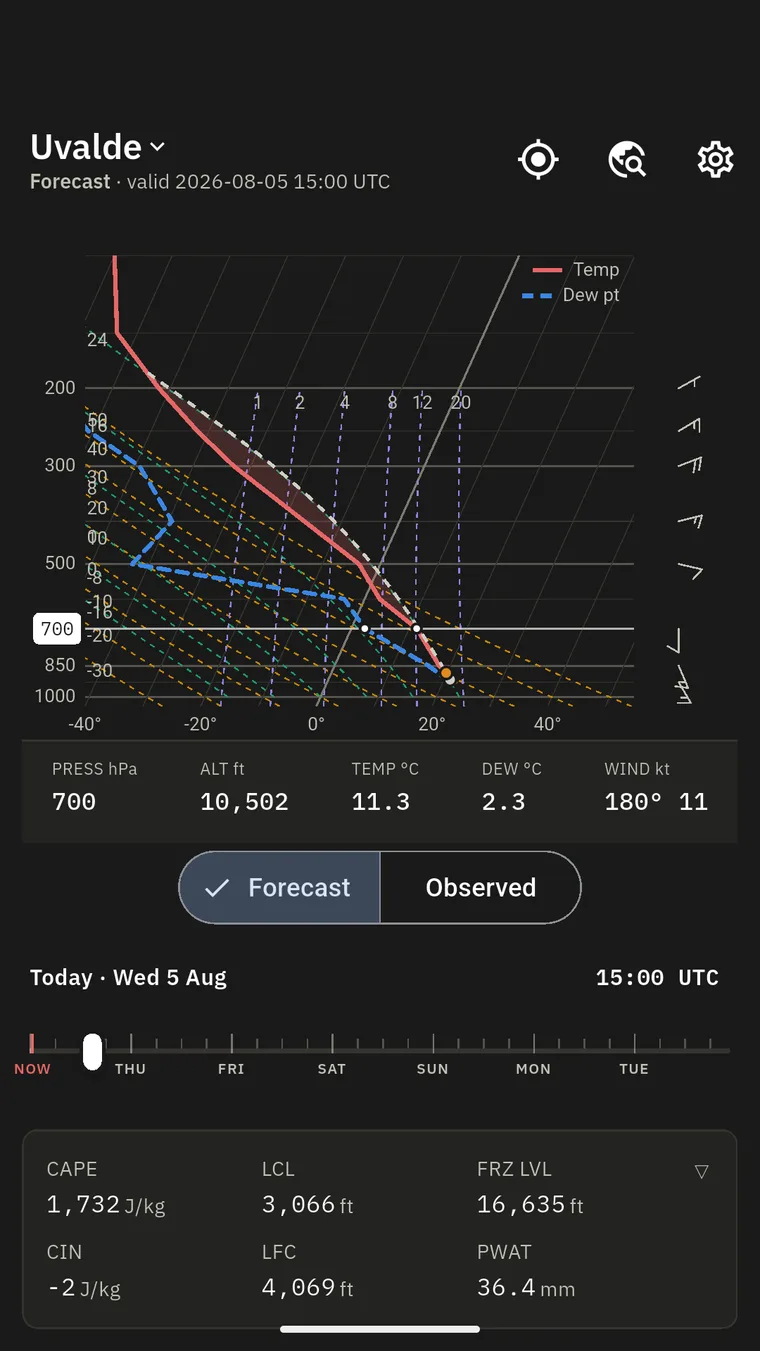
Get CAPE, CIN, LCL, LFC, and the freezing level computed alongside the chart rather than eyeballed off it.
Detail
A skew-T log-P diagram is one of the most useful and least accessible tools in preflight weather. It shows where the layers are, gives a far better forecast of cloud tops than any textual product, and matters enormously for flying where terrain and marine air interact. Reading one usually means a desktop-oriented model site, or falling back to a general-purpose weather app that was never built for the question. No Android app treats the sounding as a first-class product. That is the gap.
Pick a location by tapping the map, searching for a place, or using where you are. Skewt reopens the last place you saved and keeps the fields you come back to. The chart carries the parcel path with CAPE and CIN shaded, dry and moist adiabats, mixing-ratio lines, and wind barbs — pinch to zoom, pan, and drag a crosshair to read values straight off the trace.
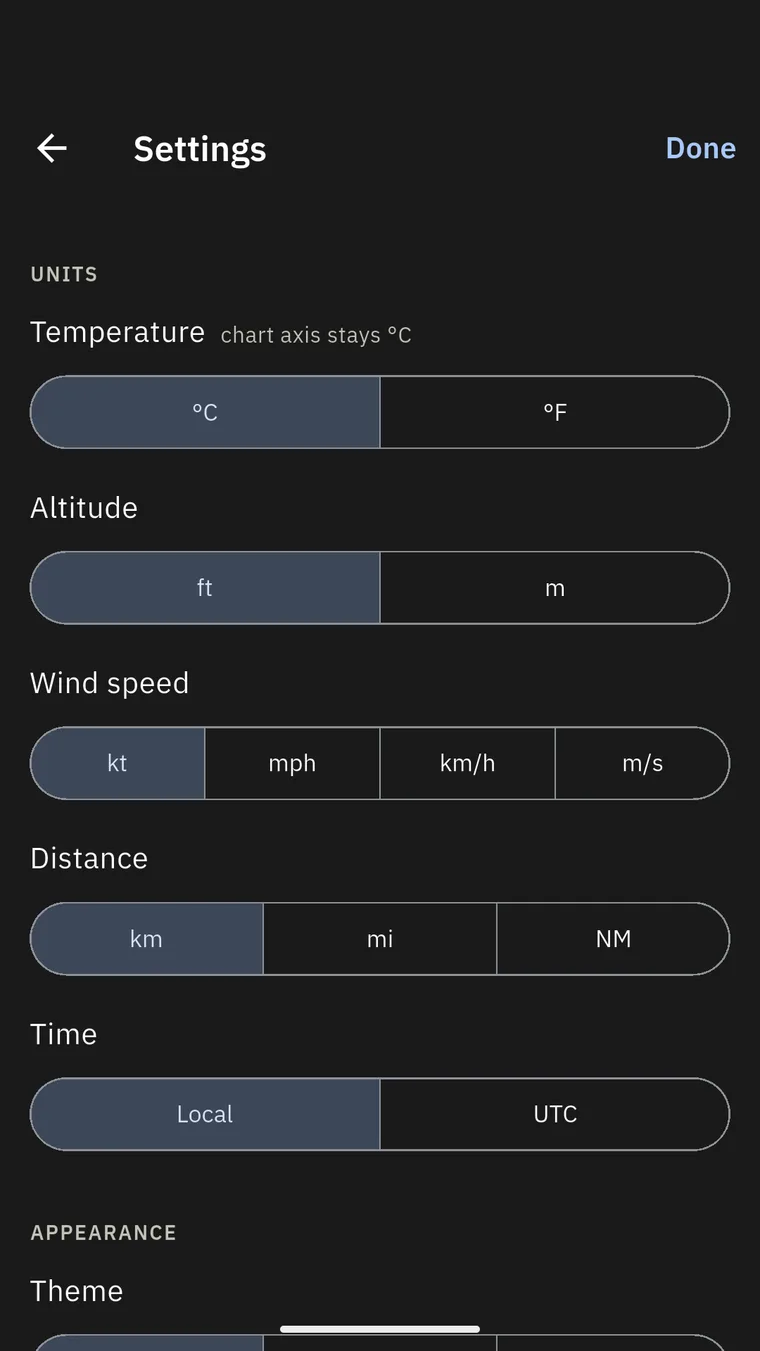
A time scrubber runs across the forecast hours, so you can watch a layer build or burn off rather than reading one moment of it. The numbers usually eyeballed off the chart are computed instead — CAPE, CIN, LCL, LFC, and the freezing level — and units are yours to set.
Forecast soundings and place search come from Open-Meteo. Observed radiosonde soundings from the nearest station sit alongside the forecast view as a source toggle, drawn from the Iowa Environmental Mesonet — North America for now. The map and the place names behind a dropped pin are Mapbox, drawn on OpenStreetMap data.
Skewt draws forecast model output and the indices derived from it. It is a planning aid, not a weather briefing, and it never authorizes a flight or a launch — your preflight briefing still comes from an official source.